Hurricane Tracking Map
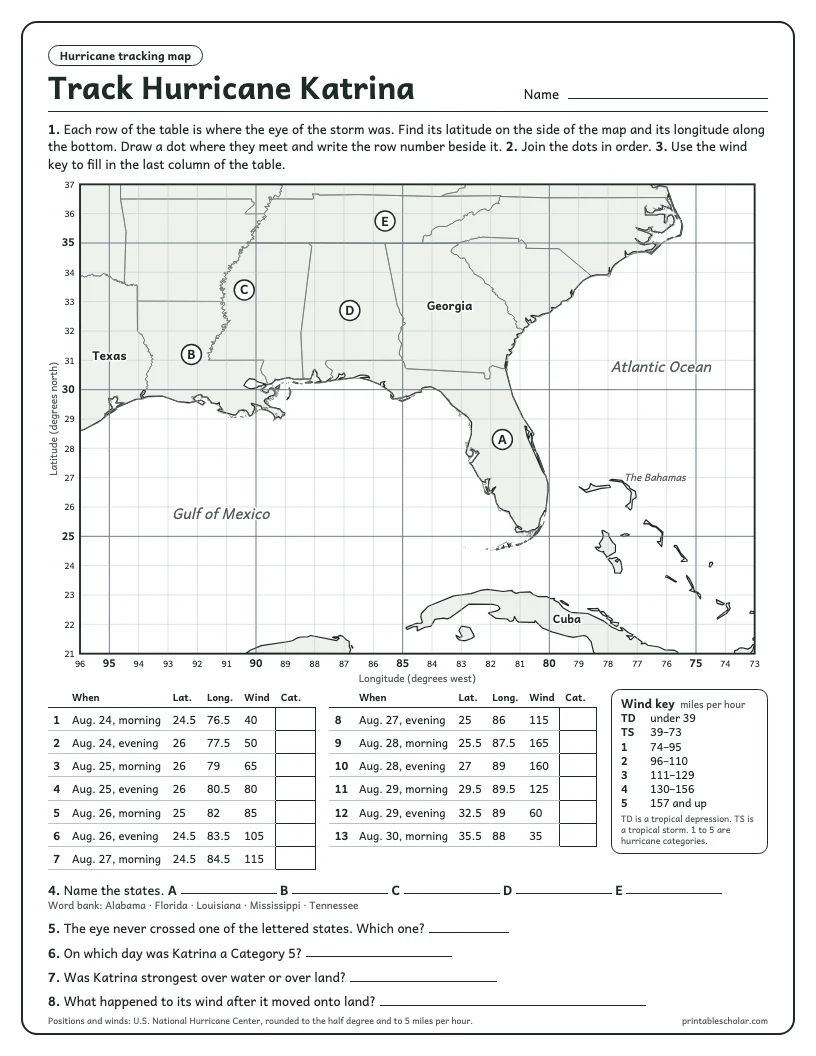
Plot the real path of Hurricane Katrina, one dot at a time. Students find each position on a latitude and longitude grid, join the dots, and work out the storm’s category from its wind speed.
Download the worksheet (PDF)What students do
- Plot 13 real positions of the storm’s eye, morning and evening, from August 24 to August 30, 2005.
- Join the dots to see the track across Florida, the Gulf of Mexico and the Gulf Coast.
- Turn each wind speed into a category with the wind key: tropical depression, tropical storm, or Category 1 to 5.
- Name five states marked on the map, and work out which one the eye never crossed.
- Answer four short questions about when and where the storm was strongest.
Answer key
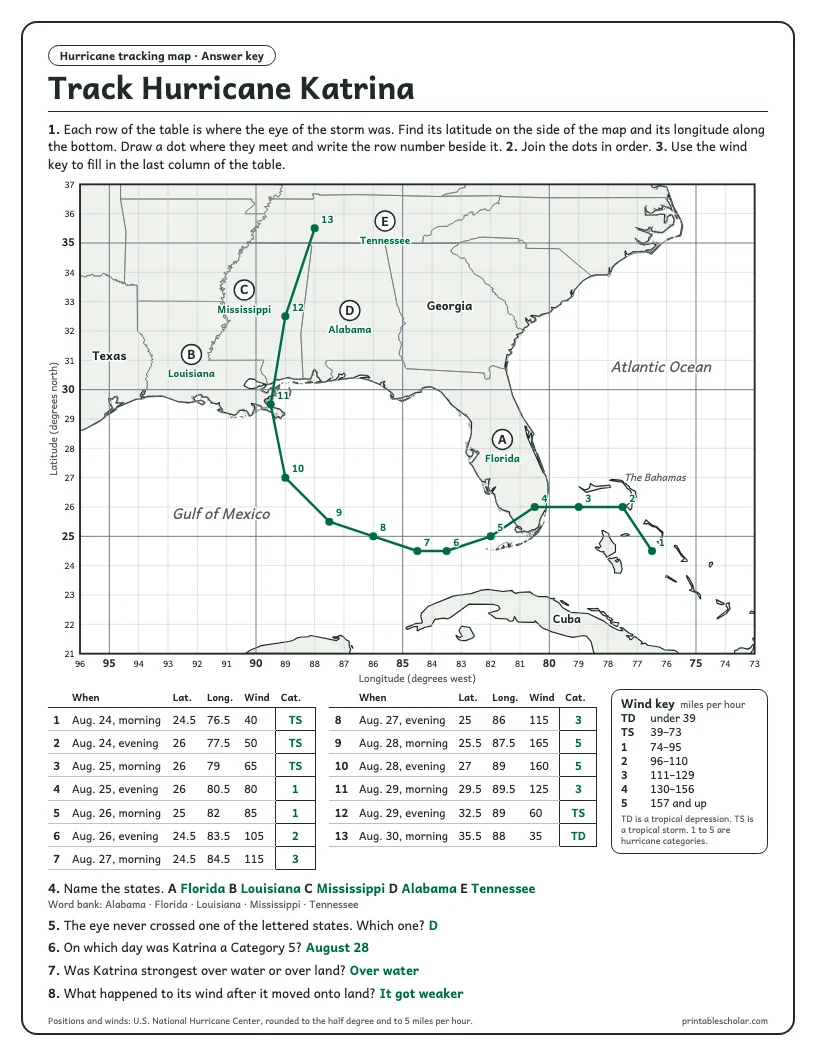
The second page of the PDF is the answer key: the finished track, every category and every answer.
How to use it
The map uses a square degree grid: every thin line is one degree, and every heavy line is five. Positions in the table are rounded to the nearest half degree, so each dot lands on a line or halfway between two. Longitude is given in degrees west, counted along the bottom of the map from right to left.
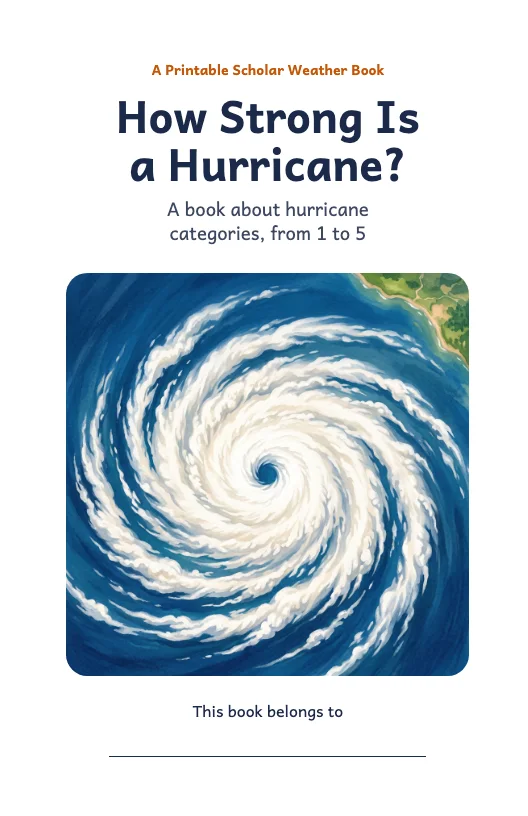
Allow about half an hour. It works well after a lesson on latitude and longitude, or beside the hurricane categories book, which shows what each category does.
Where the numbers come from
The positions and wind speeds are from the United States National Hurricane Center’s track record for Hurricane Katrina. Winds are rounded to 5 miles per hour, the way the Hurricane Center reports them. Categories follow the Saffir-Simpson Hurricane Wind Scale. Coastlines are from Natural Earth and state lines from the United States Census Bureau.
The book that goes with it