Printable Scholar
US Population Density Map
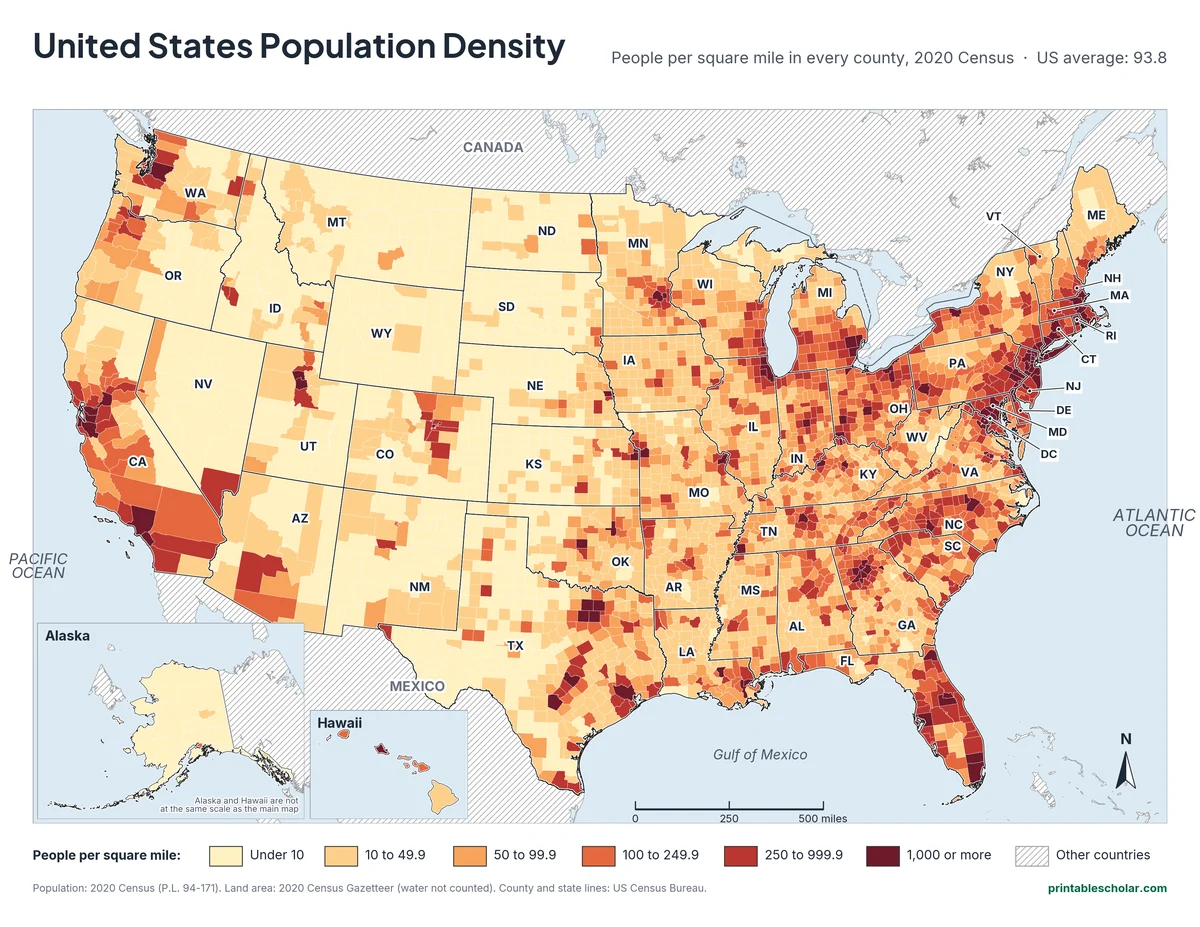
A free printable map of population density in the United States: how many people live on each square mile of land, county by county, from the 2020 Census. Alaska and Hawaii are in insets. It comes in black and white or color, with a worksheet that gives each state’s density to color by a key.
Choose your version
Black and white, color or blank.
All three are free PDFs sized for US Letter paper.

Black and white
Every county shaded in six steps of gray, with state abbreviations. No color ink needed.
downloadBlack and white PDF
Color
The same map shaded from pale yellow to dark red.
downloadColor PDF
Worksheet
State outlines with each state’s people per square mile, to color by a key, plus three questions. Black and white.
downloadWorksheet PDFWhere Americans live
Population density is the number of people divided by the amount of land they live on. In 2020 the United States had 331,449,281 people on about 3.53 million square miles of land, or 93.8 people per square mile on average. But almost no place is average. Some city counties pack in tens of thousands of people on each square mile, while many counties in Alaska and on the Great Plains have fewer than one person per square mile.
New Jersey is the most crowded state, with 1,263 people per square mile, followed by Rhode Island (1,061) and Massachusetts (901). Alaska has the most room, with just 1.3 people per square mile. In the 48 connected states, Wyoming is the least crowded (5.9), followed by Montana (7.4). Washington, D.C., which is not a state, has 11,281 people per square mile.
The map shows that most Americans live close together. The 154 counties with 1,000 or more people per square mile cover only 2 percent of the country’s land but hold 40 percent of its people. The counties with fewer than 10 people per square mile cover 46 percent of the land and hold about 1 percent of the people.
The most crowded county is New York County (Manhattan), with about 74,781 people per square mile. The emptiest is Yukon-Koyukuk Census Area in Alaska, with about one person for every 27 square miles. On the map, look for the dark band along the East Coast from Boston to Washington, the dark spots around the Great Lakes, in Florida and along the California coast, and the pale stretch from the Great Plains to the Great Basin.
Most crowded states (people per square mile)
- New Jersey: 1,263
- Rhode Island: 1,061
- Massachusetts: 901
- Connecticut: 745
- Maryland: 636
- Delaware: 508
- Least crowded: Alaska, 1.3
Find it on the map
- The dark corridor from Boston to Washington, D.C.
- Single dark counties around cities such as Denver, Phoenix and Salt Lake City
- The pale states of the Great Plains and the Mountain West
Population: 2020 Census (P.L. 94-171). Land area: 2020 Census Gazetteer files. Density = people divided by square miles of land, worked out for each of the 3,143 counties and each state. County and state lines: US Census Bureau.
Frequently asked questions
What is population density?
The number of people living on each square mile (or square kilometer) of land. It is found by dividing the population by the land area. The United States average in 2020 was 93.8 people per square mile.
Which state has the highest population density?
New Jersey, with 1,263 people per square mile in the 2020 Census. Rhode Island (1,061) and Massachusetts (901) come next. Washington, D.C., which is not a state, is far denser at 11,281.
Which state has the lowest population density?
Alaska, with 1.3 people per square mile. In the 48 connected states, Wyoming is lowest at 5.9.
Why is the map shaded by county?
Counties are much smaller than states, so they show where people really live inside each state: the cities and their suburbs come out dark, and the farmland, mountains and deserts come out pale. A state-by-state map hides that.
Does the map count lakes and rivers?
No. Like the Census Bureau’s own figures, density here uses land area only, so a county with a big lake does not look emptier than it is.
How do students use the worksheet?
Each state on the worksheet shows its people per square mile. Students pick a color for each group in the key, color the states, then answer three questions about the most and least crowded states. The county maps work as the answer check.