Oregon Physical Map
Oregon has 7 active volcanoes in the Cascades — the physical map shows them as nearly evenly-spaced peaks running north-south.
Rendered from SRTM 30m elevation data + Natural Earth rivers/lakes + US Census state boundary. Three variants below — pick the one that fits your lesson, all free.
Highest Point
Mt. Hood
11,239 ft
Lowest Point
Pacific Ocean
0 ft

Choose your version
Three variants from the same data.
Same Oregon terrain rendered three different ways for three different uses.
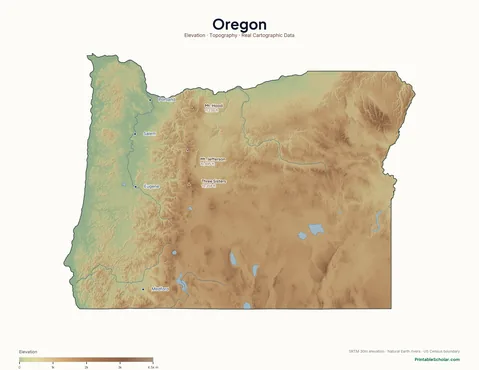
Reference / Curriculum
Featuring the Cascade Range with multiple volcanoes, the Coast Range, and the high desert east of the Cascades, with peak names + elevations and major cities labeled. Use this as the "answer key" or wall-poster reference.
download Download PDF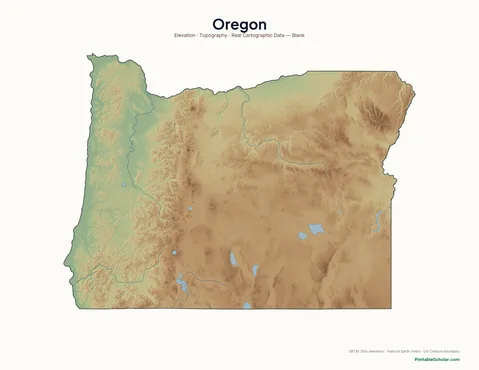
Labeling Exercise
Same Oregon terrain, no labels. Have your child identify the major mountain ranges, rivers, and physical features themselves.
download Download PDF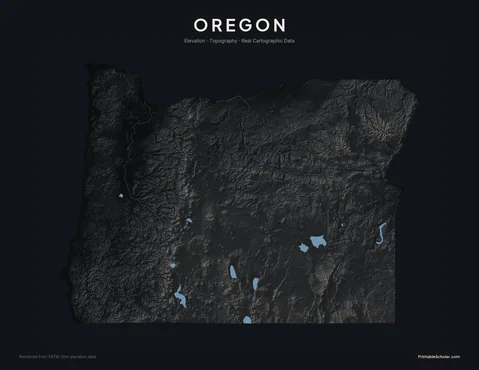
Wall Poster / Pinterest
High-contrast monochrome version. Same elevation data, dramatically rendered for wall-poster use or visual study.
download Download PDFBuilt from real data, not stock images.
Every Oregon physical map on this page was rendered from NASA SRTM 30-meter elevation data, with hydrography from Natural Earth and state boundary from US Census TIGER/Line. The terrain texture is real — every ridge, valley, and elevation contour matches what you'd see on a USGS topo map.
Read full methodology arrow_forwardPair with
Oregon political map
The blank outline version of Oregon (state borders, no terrain). Useful for political-geography exercises.
school4-5 US Geography Pack
Multi-week activity guide. Week 3 covers mountain ranges and rivers — pair this physical map directly into that lesson.
view_listAll physical maps
Browse physical maps for every state, plus continents and the world.